On profiling
Several times now, I’ve been in a situation where we would have some performance problem, and my team mates would “know” immediately what the problem was and set to work. “No, no,” I would say, “we must profile first. It could be something else than we think!” And then they’d ask me for an example, and I couldn’t come up with one, and they wouldn’t believe me, or they would believe me but think using a profiler is too much work, and they would go ahead with their original idea, and after some work, they would find out that they gained some improvement but not nearly enough. And they would be disappointed and then I would teach them to use the profiler, and profile for 15 minutes, and find something silly to fix, and get a 75% speed increase.
I’m writing this down so next time I can’t come up with an example, I can refer back to this post.
Yesterday, I was doing my yearly foobal touch-up. One of the things I wanted to fix was a performance problem where, as the year progressed and new scores were added to the data set, the program would get increasingly slow, up to the point where I’d have to remove old data from the data set if I ever was going to get an answer from the damn thing.
Here’s how the program works:
- Scrape the latest match results from some website,
- Append them to a huge xml file with all the data,
- Read the xml file and convert all the elements into data objects,
- Inject the data objects into the rule engine,
- Let the rule engine do its thang,
- Print the answer to the screen.
There were two things that I suspected might cause the slowness. The first was reading the xml and converting it into data objects: there’s a lot of data and xml might not be the most efficient way to store that. It’s a lot of string parsing, and a csv file might serve just as well. The other one was the rule engine: I’m not an expert rule engine developer, and I know at least one of the rules I wrote is very awkwardly implemented. Given the amount of data it has to process, and the fact that I don’t even know if it performs linearly, quadratically, or even exponentially, I figured it might also be the cause of the slowness.
But which of these two suspicions was the real culprit? I had no idea, so I busted out the profiler. (By the way, did you know Oracle ships for free with the Java JDK? It’s called VisualVM and it’s actually very good. Go try it out!)
After about 10 minutes, I found out that Foobal was spending most of its time not in the rule engine. It was also spending most of its time not in the xml parser. No, it was spending most of its time in the org.joda.time.LocalDate.toDate() method. What!?
Turns out I use that method only once in my application, in the data object that goes between the xml and the rule engine. Here it is:
case class Outcome(
    homeTeam: String,
    outTeam: String,
    homeScore: Int,
    outScore: Int,
    date: LocalDate) {

  def millis: Long = date.toDate.getTime

  // other methods elided for brevity
}
I added the millis method because I like to use Joda-Time, but the rule engine doesn’t. Using Longs makes date comparisons a lot easier to do for the rule engine. But why does the program spend so much time there?
If you’re familiar with Scala, you will see that millis is a def, meaning that the body of the method is evaluated each time it’s called. Turns out that it gets called a lot. Like, really a lot. So I changed it into a val, making it a property which gets evaluated only once, when the object is created.
Here’s a graph of the speed-up that I got out of that.
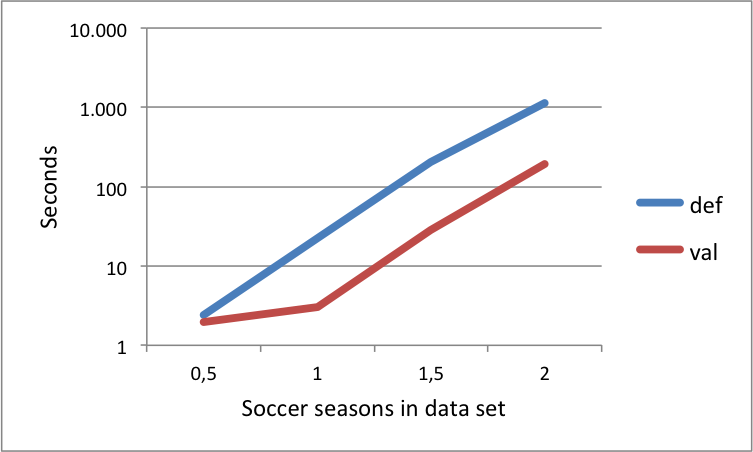
Oh, by the way: the scale of the vertical axis is logarithmic. OMG.
So the moral of the story: ten minutes of profiling and 2 seconds of changing 3 bytes, saved me a lot of time rewriting the xml to csv or messing with a rule engine that I don’t understand fully.
Another moral of the story is that I, too, am not immune to the premature optimization bug, either. If I’d had only one supsicion, instead of two, I might never have fired up VisualVM to find out the cause was actually a third thing that I would never have come up with otherwise.
Let me finish up with Donald Knuth’s quote about premature optimization:
“Programmers waste enormous amounts of time thinking about, or worrying about, the speed of noncritical parts of their programs, and these attempts at efficiency actually have a strong negative impact when debugging and maintenance are considered. We should forget about small efficiencies, say about 97% of the time: premature optimization is the root of all evil. Yet we should not pass up our opportunities in that critical 3%.”